Hey all! I run a small ecommerce biz, and I’m trying to plan my next moves for 2025 and beyond. I need trustworthy, latest Global and U.S. stats on online shopping, like how much people are spending, what’s trending, and where the market’s heading. Anyone got the latest numbers or tips on where to dig? TIA!
Hi Irem, I think it’s a really smart move to take your steps according to online shopping statistics.
I generally rely on Statista for this kind of statistical data because most of the statistics collected on different sites may not be up to date or reliable.
Here is a whole list of what I found about online shopping statistics on Statista:
The Big Picture: Online Shopping Growth & Market Size
- Global e-commerce sales will surpass $4.3 trillion in 2025 and will keep growing. By 2027 this number will be $8 trillion worldwide.
- In 2024, China led the global e-commerce revenue with $1.47 trillion, followed by U.S. with $1.22 trillion. India was third with $59 billion. (Revenue of e-commerce worldwide in 2024, by country)
- U.S. e-commerce market is growing steadily and will hit $1.9 trillion by 2029 (a 53.79% increase from 2024).
- E-commerce will account for over 21% of total global retail sales by 2029, up from 17% in 2024.
Consumer Spending & Buying Habits
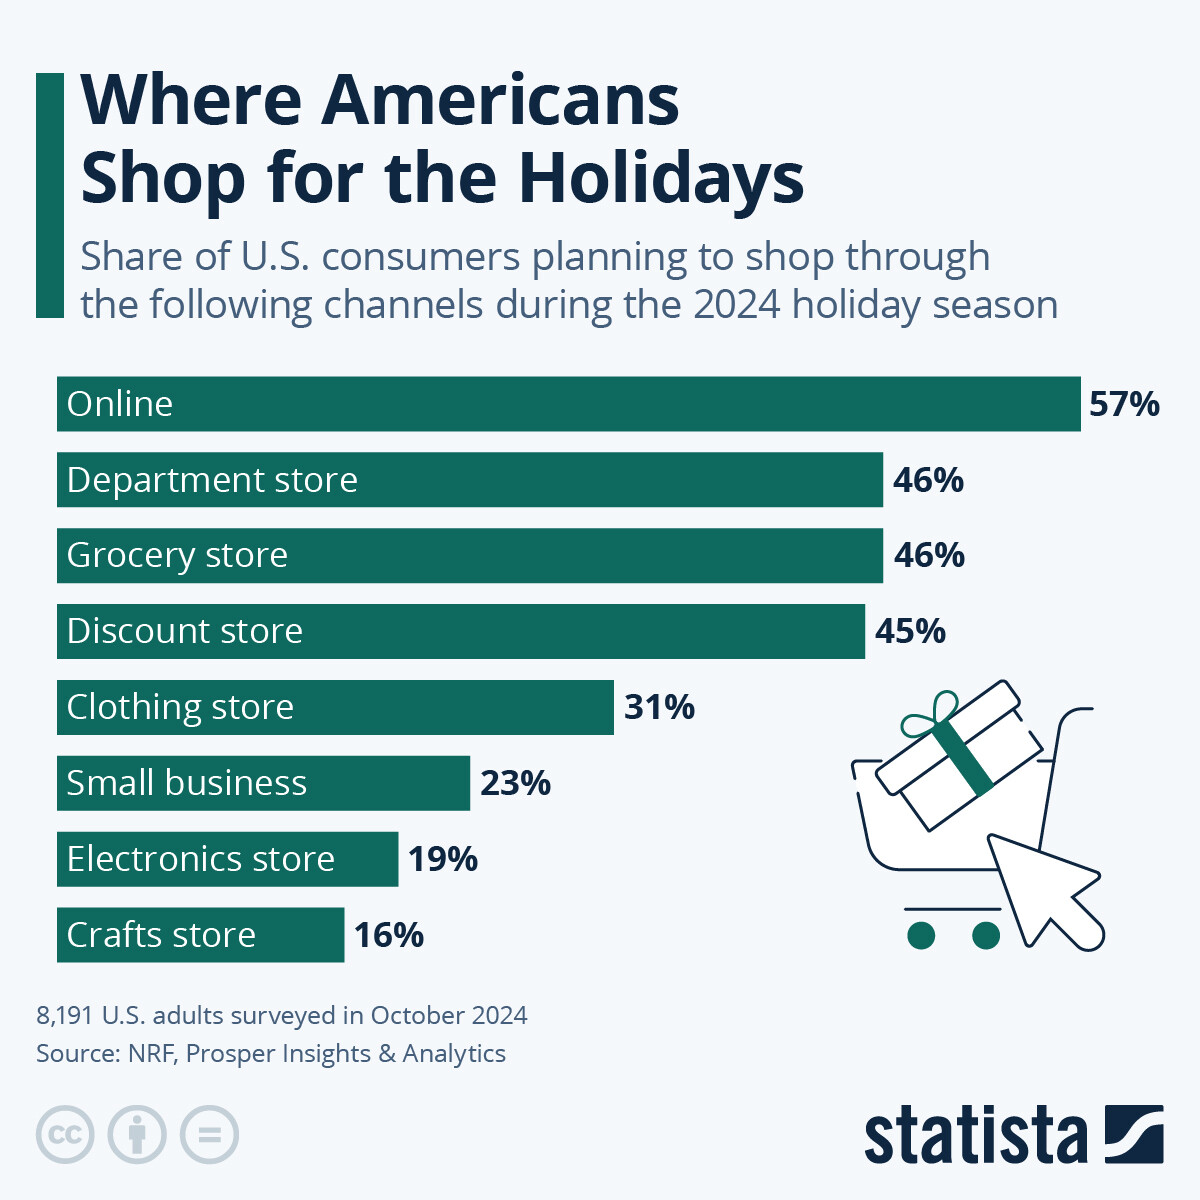
- Holiday Shopping: U.S. consumers will spend an average of $902 on holiday-related purchases in 2025, 57% will prefer online shopping over physical stores.
- Average online spending per person in 2024:
- U.S.: $3,469
- Europe: $1,000+
- Asia: $657
- Latin America: $467
- Africa: $83
By Country: The U.K. has the highest share of online shoppers (98%), followed by Vietnam.
7 Likes
Thanks so much, @nikki! This is exactly what I needed. I do have a few more things on my mind, though. With mobile traffic growing like crazy, I’m wondering how it actually compares to desktop when it comes to actual purchases.
Also, do you know which product categories are doing best online? and, one more thing, Amazon is obviously the giant here, but I’d love to know more about what other big players are shaping the market.
4 Likes
Glad this helped!
And for the other points you asked about:
Mobile vs. Desktop Shopping Trends
- Mobile is leading the way. In Q4 2024, 78% of all retail website visits came from smartphones, and 68% of orders were placed on mobile. So it’s not just for browsing; people are actually completing purchases.
- Cart abandonment is still a big issue, especially for certain products.
- Home furniture cart abandonment: 90% of mobile carts were abandoned (83% on desktop).
- Biggest reasons: High delivery fees (41%) and unexpected costs at checkout (30%).
- If you want to boost mobile conversions, transparent pricing and better shipping options could make a big difference.
Best-Selling Categories & Conversion Rates
- Beauty & Skincare: Huge demand, especially in the U.K., where 30%+ of people aged 25-49 buy these products online.
- Food & Beverage: Has the highest conversion rate at 3.1%.
- Slowest-growing categories in the U.S.: Baby supplies and non-alcoholic beverages.
E-Commerce Giants & Market Leaders
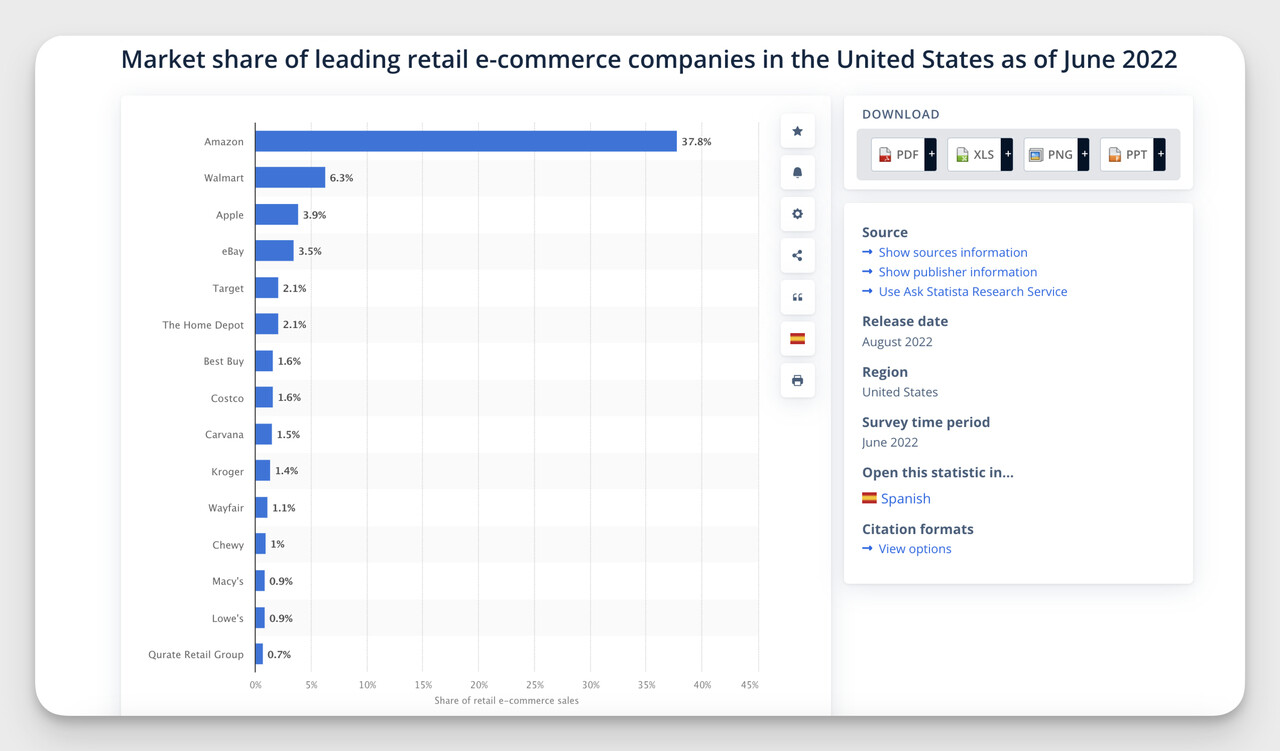
- Amazon: Still dominating with $152 billion in net sales and a 37.6% market share in the U.S…
- JD.com: Second place with $117 billion in sales.
- Walmart: Holding strong with $77.6 billion in revenue.
- Amazon’s third-party seller services made $47.7 billion in Q4 2024 alone, its marketplace model is massive.
4 Likes
Hey, in addition to the Statista stats above, I wanted to add the ones about frequency of online shopping:
- 20% of consumers make online purchases once a week
- 24% of shoppers buy online every two weeks
- The largest group, 31%, makes online purchases once a month
- 15% of consumers shop online three to four times per quarter
- 10% of shoppers also engage in online shopping every two weeks
This is another thing that I think is important: In 2022, there were 268 million online shoppers in the United States. This number will increase to almost 285 million online shoppers in 2025.
By 2040, it is predicted that 95% of all purchases will be done online.
2 Likes
Suggest you look at the content of Seller Commerce, which offers important insights and includes data for 2025. It covers the biggest ecommerce markets and the demographics of each market and they use visuals like the one below. Tidbit!
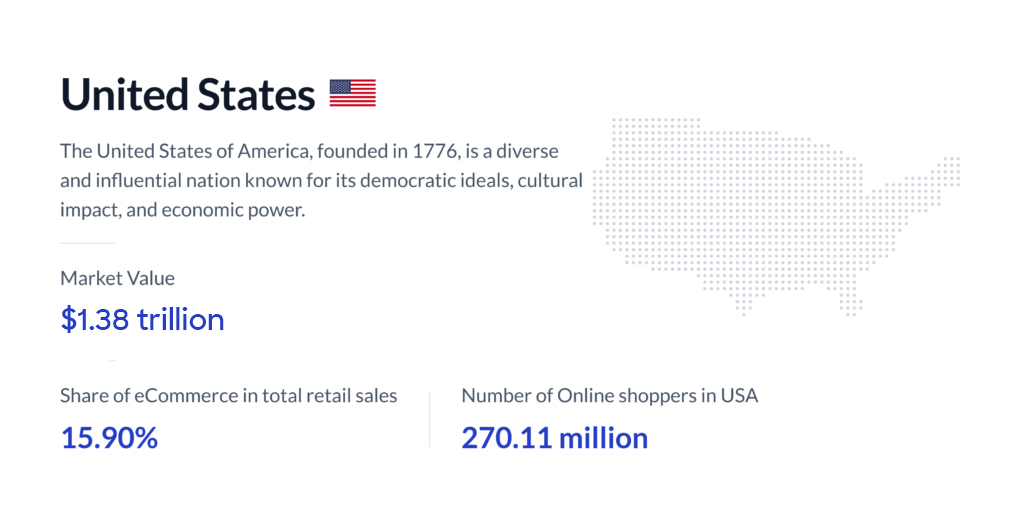
3 Likes
hey LISTEN UP!!
Statista confirms what we already knew: 78% of retail website visits come from smartphones, and 68% of orders are placed on mobile. This isn’t surprising it’s obvious!! And if you’re not already thinking mobile-first, ur basically living in the past.
Everyone drop what you’re doing and get latest mobile commerce numbers. Adjust ur plans, cuz this is where everything’s heading!!
![]() 72% of global e-commerce sales in 2023 were through mobile.
72% of global e-commerce sales in 2023 were through mobile.
![]() This is jumping to 88% by 2027. That’s basically almost everything moving to mobile.
This is jumping to 88% by 2027. That’s basically almost everything moving to mobile.
![]() U.S. numbers? Even crazier:
U.S. numbers? Even crazier:
![]() Mobile shopping racked up $470 BILLION in online purchases in 2023.
Mobile shopping racked up $470 BILLION in online purchases in 2023.
![]() That’s a 12% YOY increase, and it’s only going UP.
That’s a 12% YOY increase, and it’s only going UP.
![]() By 2025, mobile commerce is expected to hit $728.28 BILLION.
By 2025, mobile commerce is expected to hit $728.28 BILLION.
So, stop ignoring mobile! Your strategy should be = MOBILE-FIRST or DEAD LAST.
2 Likes
Absolutely right!!! By 2026, 69.2% of the US population is expected to be mobile shoppers. and if your cart abandonment rates have skyrocketed, you’ll want to hear this too: A study in 2023 found that 74% of consumers are more likely to return to an online store if it’s optimized for mobile use.
1 Like
Since @amari-fioravanti mentioned cart abandonment rates, I wanted to bring this up, because it’s a massive challenge in online shopping that costs businesses billions every year.
-Nearly 70% of online shopping carts are abandoned.
-That’s over $18 billion lost annually for e-commerce businesses.
So why customers abandon their shopping carts?
-
48% of shoppers abandon their cart due to unexpected extra costs, such as shipping fees and taxes.
-
22% of users leave because of slow delivery times.
-
25% of shoppers abandon their cart when required to create an account before checking out.
Cart Abandonment Rates and Solutions
While cart abandonment is a common challenge, there are effective ways to reduce it and recover lost sales:
1. Be transparent about costs. Extra fees at checkout are one of the top reasons for cart abandonment. Displaying shipping costs and taxes early can prevent last-minute drop-offs.
2. Use well-timed on-site messages. A clear and well-placed popup offering free shipping, a discount, or a reminder about items left in the cart can help keep customers engaged before they leave. You can try Popupsmart to create cart abandonment popups without disrupting the shopping experience.
3. Send cart abandonment emails. Follow-up emails can be highly effective, with an average open rate of 45%. Among those who open the email, 54% say they would complete the purchase if offered a discount. Didn’t get a reply? You can check out any tips for sending a follow-up email here.
4. Offer guest checkout. Requiring shoppers to create an account can create friction. Providing guest checkout option allows them to complete the purchase faster.
Optimize checkout for mobile. With 68% of orders now placed via mobile, a seamless checkout experience on smaller screens is key. A complicated or slow process can lead to frustration and abandonment.
3 Likes
Wow, this has been a great conversation! I wanted to add two more big changes happening in e-commerce in 2025:
Social media platforms are driving sales!
Social commerce is no longer just a trend, it’s a dominant force in e-commerce.
- 58% of U.S. shoppers have made a purchase after discovering a product on social media.
- 44% of U.K. consumers have done the same.
- 40% of German shoppers reported buying products they saw on social platforms.
- U.S. social commerce sales hit $75.6 billion in 2023, and this number keeps climbing with seamless in-app shopping on Instagram, Facebook, and TikTok.
2 Likes
you guys are awesome!! ![]() I didn’t expect so many amazing insights, thank you all so much!
I didn’t expect so many amazing insights, thank you all so much! ![]()
OMG, how has nobody mentioned payment methods yet?! ![]() Okay, I’ll fix that because trust me, how people pay online is just as important as what they buy. Here’s the latest on what’s trending in online payments:
Okay, I’ll fix that because trust me, how people pay online is just as important as what they buy. Here’s the latest on what’s trending in online payments:
![]() Digital Wallets Win
Digital Wallets Win
In 2023, 48.9% of all global e-commerce transactions were made with digital wallets like PayPal, Apple Pay and Google Wallet. It’s the number one payment method globally and it’s growing!
![]() Buy Now, Pay Later (BNPL) Is Taking Over
Buy Now, Pay Later (BNPL) Is Taking Over
BNPL services like Afterpay and Klarna are on fire, especially among younger shoppers. By April 2024, BNPL made up 11% of all online purchases in the U.S. and retailers are adding it as an option fast.
![]() Credit & Debit Cards Still Matter
Credit & Debit Cards Still Matter
Even with the rise of digital wallets, credit and debit cards aren’t going anywhere. In 2023, 52% of U.S. shoppers used a debit card for online purchases and 47% used credit cards. So yeah, plastic is still cool!
![]() Bank Transfers Are a Thing Too
Bank Transfers Are a Thing Too
In Europe and Asia, 25% of shoppers prefer direct bank transfers for online shopping. Not as flashy as BNPL or wallets, but still a major player!
![]() Mobile Wallets Are the Future
Mobile Wallets Are the Future
In 2023, mobile wallets handled about 50% of all e-commerce transactions worldwide, and this is just the beginning. Expect a 14.9% CAGR from 2023 to 2027, mobile payments will get even bigger!
So, in short: if your e-commerce business isn’t optimized for digital wallets, BNPL and mobile payments, you’re leaving money on the table! ![]()
3 Likes